
For UK commercial and industrial renewable portfolios
The Operating System for Renewable Energy Assets
Monitor, predict and optimise every solar, wind and hydro plant from one intelligent platform.
Live Monitoring, AI Forecasting, Asset Performance, O&M Workflows, SCADA & API
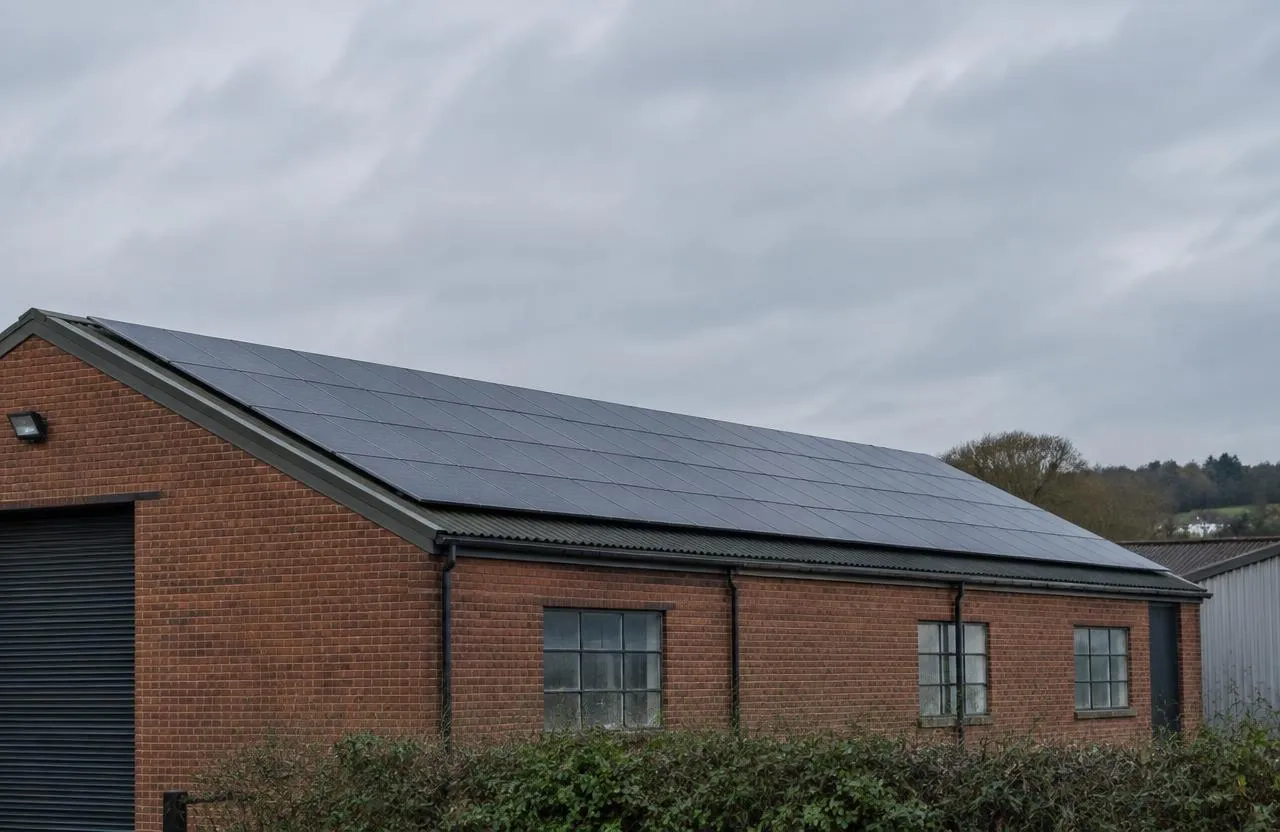
Live output
2.66 MW
Today
14.2 MWh
Availability
96.8%
| Site | Output | PR |
|---|---|---|
| Ashford Distribution Centre | 812 kW | 84.1% |
| Maidstone Cold Store | 446 kW | 81.7% |
| Canterbury Farm Array | 0 kW | n/a |
| Tonbridge Works Roof | 298 kW | 78.2% |
| Dover Logistics Hub | 1104 kW | 85.4% |
Works with the inverters in your portfolio
The questions asset owners and O&M teams ask every day
Portfolio live view
From fleet to a single string in four clicks
Start with portfolio availability, open the plant, find the inverter, read the alarm. Every level shows production, capacity and performance.
- Lost generation: See how many kWh each fault costs, plant by plant.
- Availability: Track availability across the whole portfolio in one view.
- Downtime: Find inverters that stopped before your monthly report does.
- Revenue impact: Translate underperformance into pounds, not just percentages.
- 07:40
CriticalCanterbury Farm Array
INV-03 grid fault, output 0 kW
- 07:52
MajorTonbridge Works Roof
String 2.4 current 41% below peers
- 08:15
MinorAshford Distribution Centre
Comms latency above 10 min
Loss analysis
Turn asset data into avoided losses
Downtime, curtailment, underperformance and open faults are converted into estimated lost revenue so you fix the most expensive problem first.
Estimated lost revenue today
Sample data£2,325
AI that acts
Detect, predict, decide, act
AI is an operating loop, not a chatbot. Every insight ends in an action you can verify.
- Signal: Inverter 12 output deviates 18% from the expected curve.
- Context: Irradiance, temperature and past behaviour compared.
- Impact: Estimated production loss: 420 kWh per day.
- Action: Inspection work order created and assigned.
- Outcome: Production recovery verified after the fix.
Canterbury Farm Array, expected vs actual
Shaded: 09:00 to 11:30, 420 kWh below expected.
O&M workflow
From alarm to recovered production
Create a work order from an alarm, assign a technician and confirm the plant is back to expected output.
- Anomaly, Work order, Technician, Resolution, Recovery
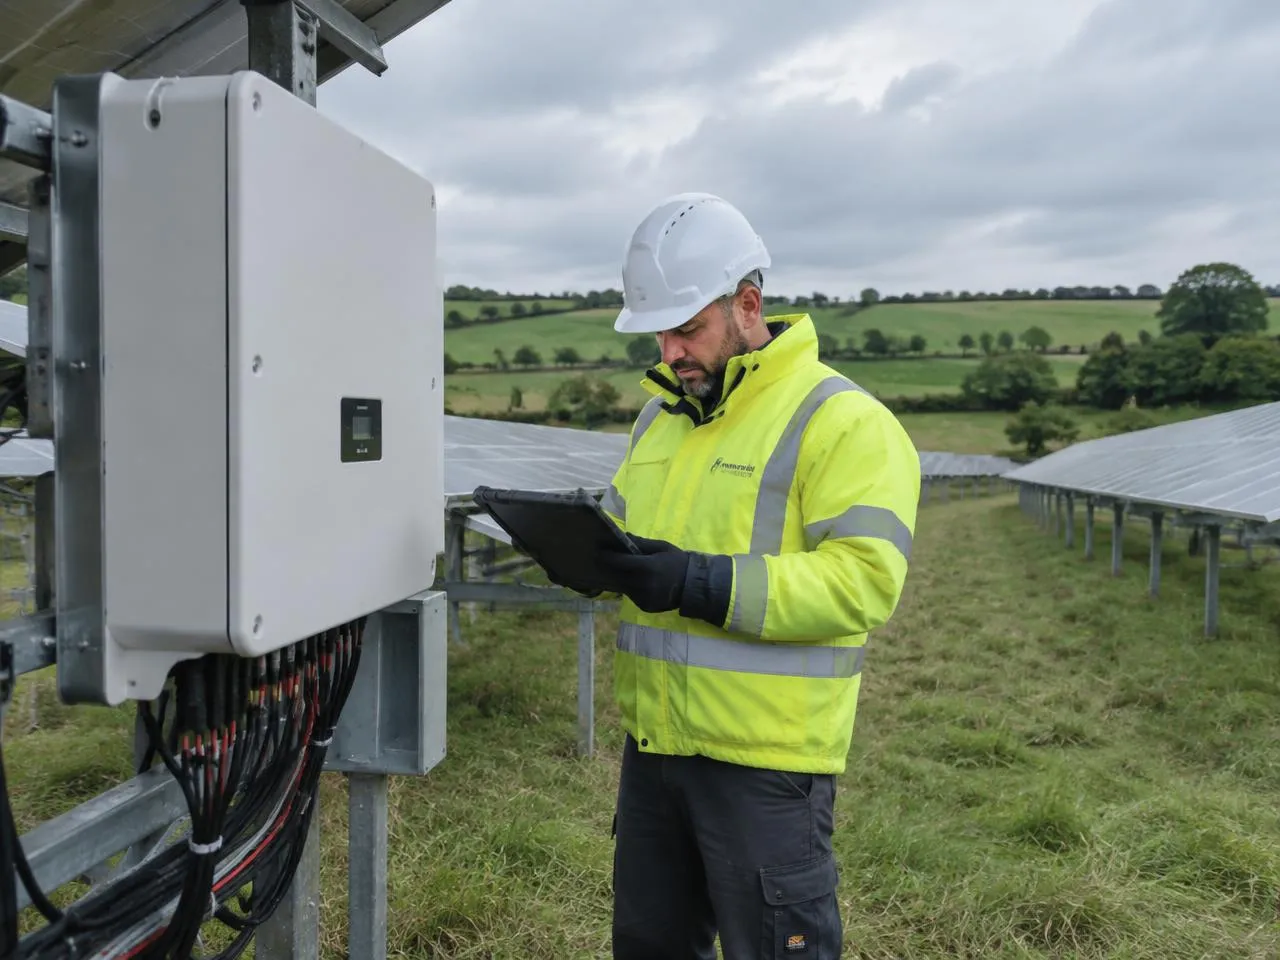
WO-2318 Inspect INV-03
ResolvedIntegrations
Every data source, clearly labelled
Inverter APIs and cloud portals
LivePolling, 5 to 15 min refresh
Meters and IoT sensors
LiveLoRaWAN and meter data
Weather and irradiance
LiveHourly regional irradiance
REST API (WorkyApi)
LiveRead plant, production and alarm data
MQTT
BetaStreaming device data
FTP and file ingestion
On requestScheduled CSV import
SCADA / PLC
On requestSite controller integration
OPC UA
On requestIndustrial data connector
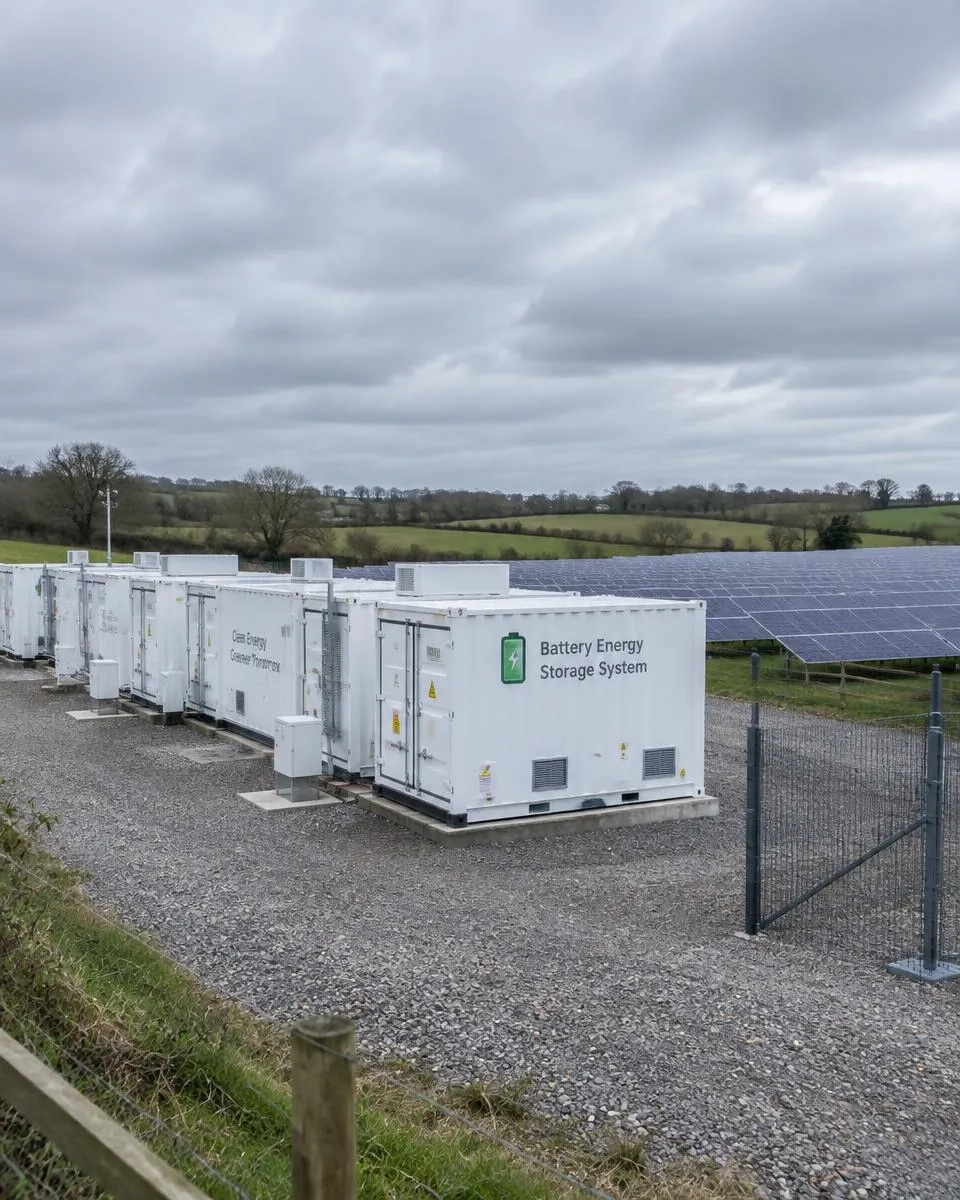
Multi-asset
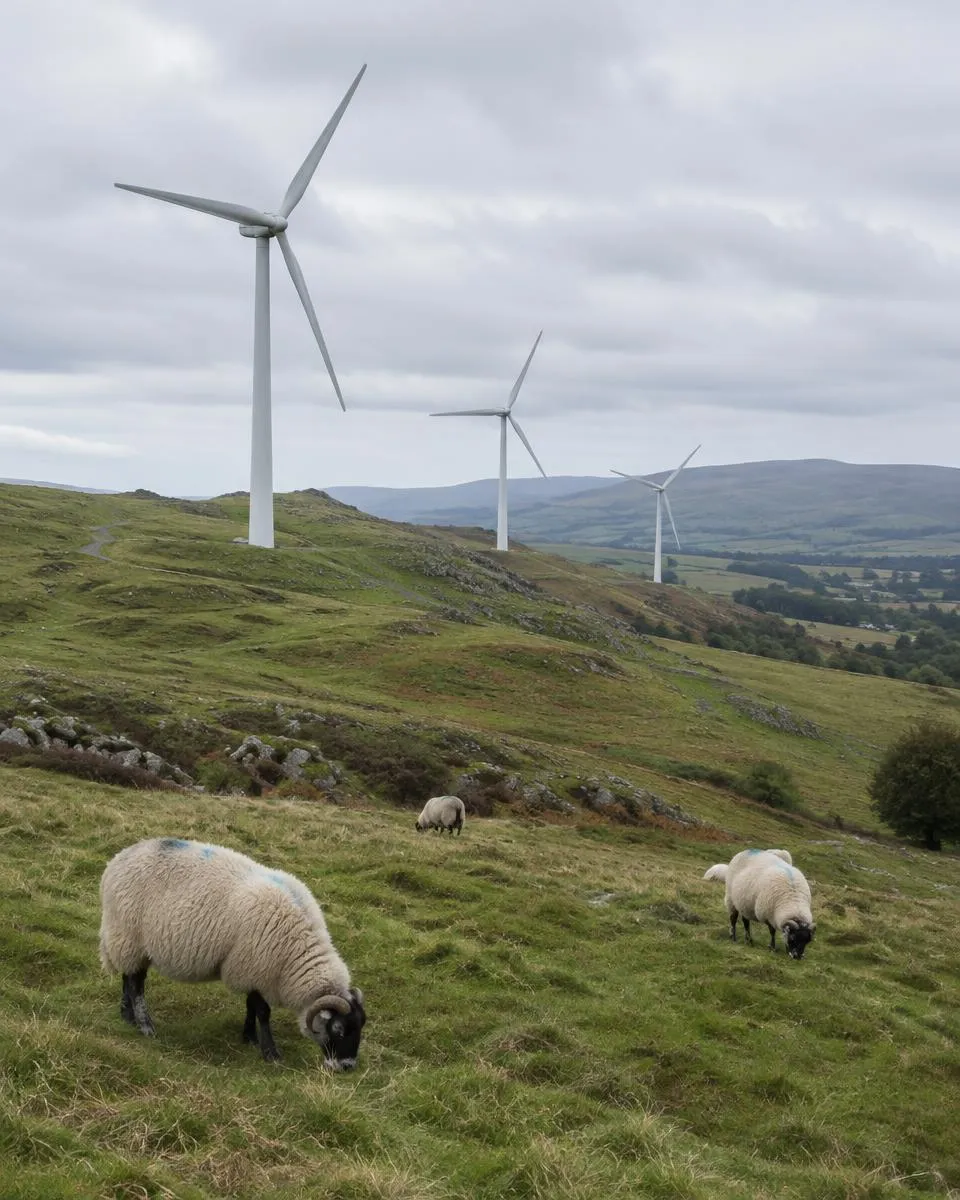
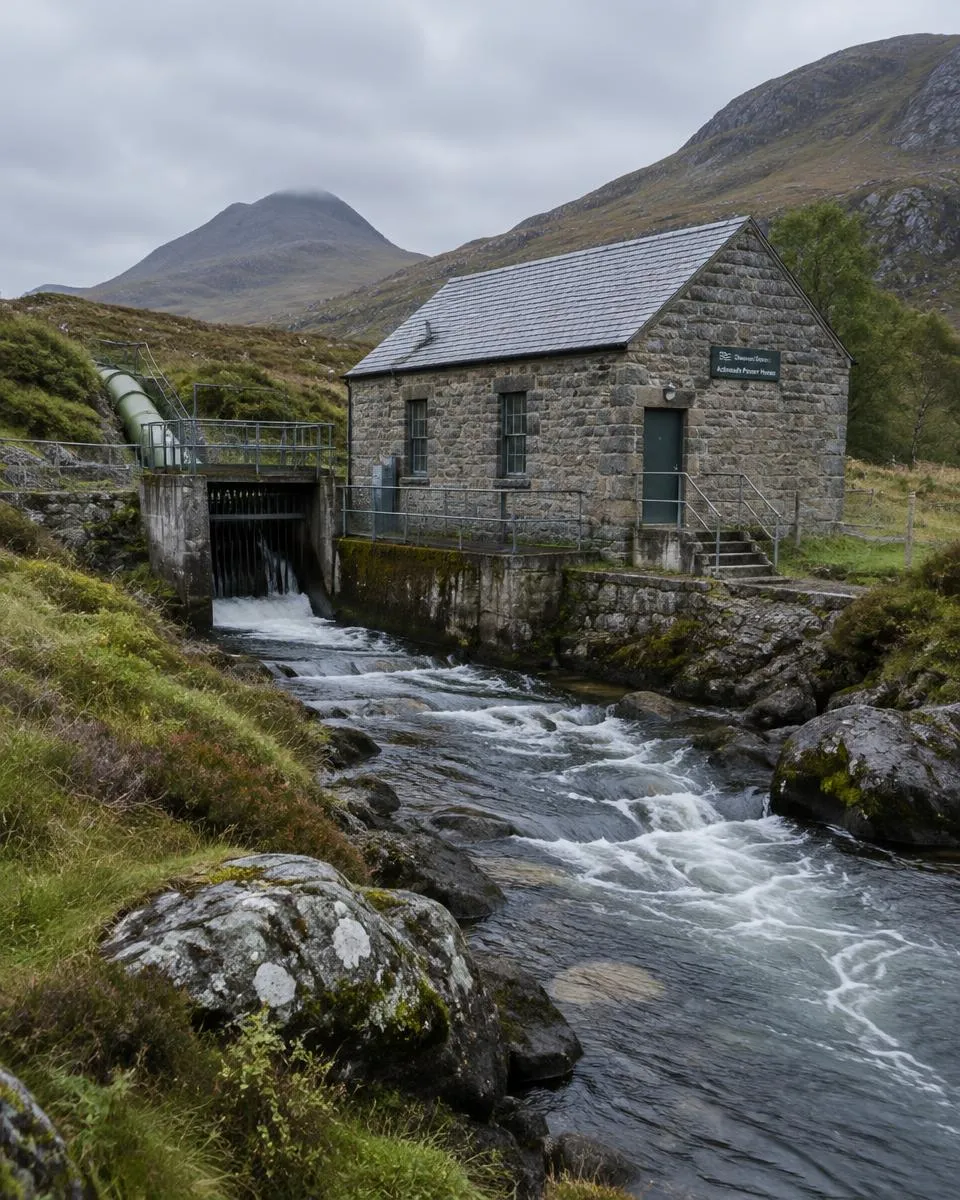
One platform for mixed portfolios
WorkyBe ecosystem
Strong alone, stronger connected
- WorkyFieldFault to work order to technician
- WorkyTradeForecast to market price to trading
- WorkySensSensor and LoRaWAN field data
- WorkyEttaMulti-site energy management
- WorkyApiUnified API and data access
New in WorkyPower
Built with UK operators this year
Generation reconciliation
Export meter against inverter totals, so you spot metering gaps and unbilled kWh.
Learn moreExpected-yield alarms
Upload your PVsyst yield; deviations beyond your threshold raise an alarm.
Learn moreNetwork charge comparison
Distribution charges per site compared with your contract, month by month.
Learn moreRole-based home screens
Owners see revenue, O&M teams see alarms and jobs, finance sees monthly reports.
Learn moreBuilt for operators
Enterprise basics included
FAQ